
Identifying Fake Twitter Trends with Hoaxy

At first glance, the Trending list on Twitter seems to be a major criterion for the most important topics in circulation. Many journalists use Twitter to make editorial determinations, catering their coverage to what is perceived as popular – and analysis of “semantic similarity” between news reports has even revealed a link between what reporters see on their own Twitter feeds, and what coverage ultimately makes it to air or print.
Trends on Twitter are not always accurate, however, and sometimes include false hashtags which may lead to false or misleading news reports as information disseminates at a rapid pace within the modern newsroom.
Many parties, including non-state actors, so-called “electronic armies” of ideological influencers, and even governments themselves, have an interest in manipulating content online. A 2018 BBC investigation even found that companies, including some in the Kingdom of Saudi Arabia, offer content manipulation services on platforms like Twitter for as low as $150, allowing various spammy hashtags and phrases to trend at the behest of automated accounts and concerted spam efforts.
In this article, journalists will learn how to assess and verify accounts involved in the dissemination of false hashtags and Twitter trends, and learn how to further verify accounts which share and retweet these false hashtags by using Hoaxy – a social media analysis tool developed by the Observatory on Social Media at Indiana University.
Before we start using this technology to verify trending topics, we need to know the difference between real trends and fake trends, whether hashtags or keywords.
Real Trends
Most of the time, phrases and hashtags trend organically when commentary on a particular subject converges in a natural way, by following the usual social pathways. When discussions on a particular subject converge and multiply, this subject will likely appear on Twitter’s trending list, ranked by popularity – that is, the frequency in which the phrase or hashtag is mentioned. This natural momentum can be accelerated when public figures, activists, influencers, and major brands, many of whom have millions of followers, mention the trending topic or hashtag in their tweets.
Fake Trends
Fake hashtags, on the other hand, trend inorganically: their growth is driven by either bot nets (automated accounts) or spam nets (manually controlled accounts), and may originate internally or externally from a variety of actors. These networks systematically amplify hashtags and phrases in a variety of ways, and may often inorganically amplify trends which otherwise began organically, which further complicates the identification process. However, this process is the fundamental to addressing inorganic activity on Twitter.
Regardless of whether an account’s activity is automated, each fake account is ultimately connected to an actual human operator or group of human operators, usually operating under a pseudonym. Accounts operated directly by a human can be identified contextually based on a variety of factors, including:
- An account biography which contradicts other sections of the account, namely its tweets.
- Followers or following lists containing seemingly spammy accounts, or followers and following lists containing accounts far from the country where the main account was created.
- A “default” listed birth date, i.e. January 1st. Twitter technically defaults the birthdate to the date in which the account was created, but January 1st is a common low-effort way of creating accounts en masse with little extra effort.
- Tweets phrased similarly to, or otherwise phrased exactly like, tweets made by other accounts.
- Engagements and interactions (i.e. replies, retweets, and likes) with known fictitious accounts.
Bot net accounts, on the other hand, engage in automated activity managed by a code script or software program, which coordinates activity across thousands of accounts with limited human intervention. These accounts may also be identified contextually based on a variety of factors:
- Numerous accounts containing matching profile pictures.
- Numerous recently created profiles, or accounts created in bulk around the same time (within a month of each other).
- No search history or history of being mentioned by other accounts on Twitter.
- “Default” usernames derived automatically from the account’s name, usually containing a partial first and last name followed by a string of numbers, i.e. “MichaelRo7585452”.
- Heavy tweeting activity, upwards of 50 times per day.
Luckily, a number of tools exist which allow us to identify fraudulent account activity using diffusion network analysis, including Hoaxy.
Getting Started with Hoaxy
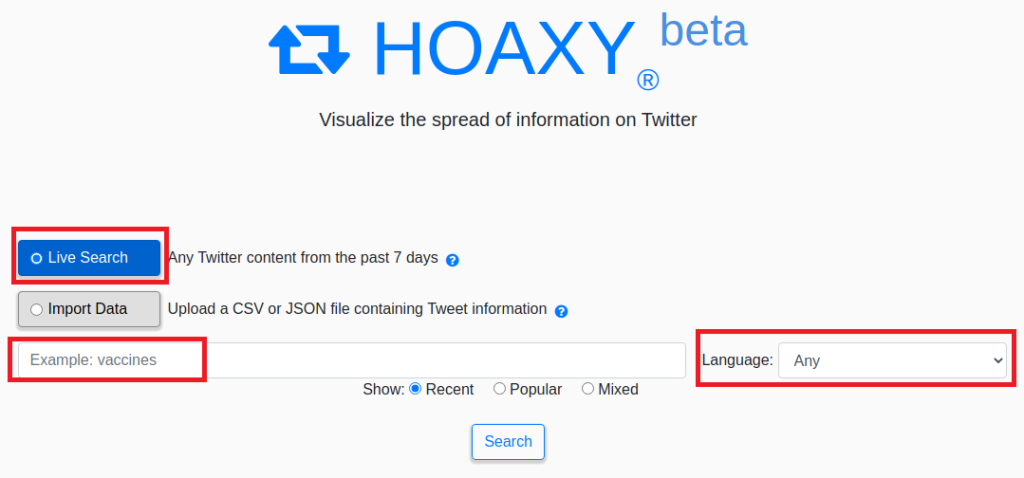
To begin, select either a live search or, if you’re working with a particular collated dataset, import a CSV or JSON file in the appropriate format (more on this below).
Put the phrase you’re analyzing into the search box. The search function supports standard boolean operators and numerous languages via Twitter’s search API, but for simplicity, we’ll search for a single keyword in English first.
After inputting the query and hitting search, a map of the term’s tweet network will appear. Each individual circle represents an account which mentioned the query in question, whether by tweet or retweet.
From here, we can click the play button to see the first account which tweeted the hashtag, and its subsequent spread across various ecosystems.
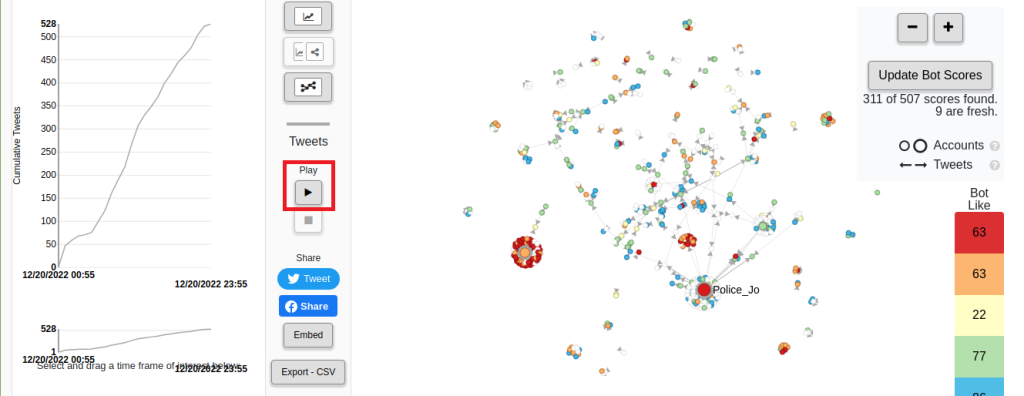
Hoaxy allows us to measure the spread of a particular term on a granular level, showing cumulative tweets from the moment the term first appeared to the current date and time. Below the primary cumulative tweets graph, users can select a specific timeframe across which to track the spread of a particular phrase or hashtag, and watch it spread across the selected time period by clicking the play button again.
Arrows extending out from each main circle represent retweets, while the circle at the chart’s center represents the original tweeter. By clicking the zoom ( – +) button at the top right hand corner, we can narrow down into a particular ecosystem to obtain a clearer view of the accounts involved. More arrows extending from the primary circle means more retweets, and greater amplification of the phrase or hashtag involved.

Arrows pointing outward represent retweets of the primary account’s tweet, while arrows pointing inward represent mentions of the original account, i.e. replies to a tweet containing the referenced search term or hashtag.

Each circle, representing a unique account, also has an assigned color, ranging from blue to red. Accounts on the blue end of the spectrum display less automated behavior, according to “Botometer”, a proprietary bot analysis tool also developed by Hoaxy’s creators, the Indiana University Observatory on Social Media.
This analysis isn’t perfect, however. Many human-run accounts which tweet rarely, preferring to monitor their feeds quietly, may be falsely classified as bot-like; as may human-run accounts with a default name containing a string of numbers, and large accounts which tweet heavily, such as blogs.
I faced this matter myself after noticing that one of my friends on Twitter was falsely classified as bot-like. So I asked Onur Varol, an assistant professor of computer science at Turkey’s Sabanci University and one of the creators of “Botometer”, about the reason behind this classification.
The account name, he said, had a default layout – it contained a portion of my friend’s first name, and a long string of numbers afterwards. He also said Botometer detected that my friend’s account was created in 2018, but only tweeted once, a year later, in 2019. All of these factors, Varol said, led to the faulty bot determination.
“Botometer uses machine learning to make judgements,” Varol said. He noted that users should “pay extra attention when evaluating a non-English speaker’s account” because Botometer uses a universal score to evaluate content for each account, and that many human users may still use automated tools or services for posting, “which may make the account look more bot-like.”
Accounts may likewise be falsely labeled in the opposite direction: sometimes, accounts which engage in automated or concerted activity may be deemed by Botometer to be less bot-like. This highlights the importance of approaching each individual account in context, and using situational clues involved in the broader social diffusion network to determine the nature of a particular account.
By clicking on the right color chart, we can isolate accounts based on their Botometer score, showing us only accounts with that colored circle.

If we click on an individual account within this network, we see the exact pathway by which a correlation is being drawn. Each account, connected to the parent account, shows a broad diffusion network, including quote-tweets, mentions, and retweets both by the account in question and by other accounts which have amplified the account in question.

Some accounts only have a white circle, meaning their account has not yet been evaluated by Botometer. An account’s bot score can be refreshed by clicking on the white circle, then clicking “update” to pull data metrics from Botometer’s API, which will assign the circle a relevant color based on its bot-like activity.

Verifying Twitter Trends Based on Hoaxy Visualizations
By referencing Hoaxy’s data visualizations, we can determine the relevant nature of a social ecosystem, or diffusion network. Generally, an unconcentrated group of circles and arrows spread out across a large area indicates that the trend in question is propagating naturally by virtue of normal conversations held by human-run accounts, as does an unconcentrated group of circles connected to a major primary account, like that of a public figure, activist, or influencer. We can use color coding to make further determinations on the likelihood of automated activity within a specific grouping.

Ecosystems reflecting fraudulent or automated activity, on the other hand, tend to have tighter groupings reflecting a self-contained environment of sharing and re-sharing among each other. These accounts may be grouped together among each other, or in connection to a larger primary account, like a public figure, activist, or influencer, whose trend is being amplified.
The automated nature of these groupings can further be determined by the accounts’ Botometer score; individual accounts may be mis-labeled as automated, but large groupings of orange or red circles, reflecting a high potential for automated activity by each individual account, may reflect a consistent trend of automated activity at scale.

After narrowing down a relevant dataset, including search query and relevant timeframe, the results presented by Hoaxy can be shared to social media by clicking the indicated social media buttons, or downloaded in either .csv or .json file format by clicking the “export” button in the bottom left corner.
Downloading search results in .csv or .json format presents an appropriately formatted dataset, which can be subsequently reverse-engineered by plugging an externally compiled dataset using the pre-set columns generated in the downloaded file. Users can then compile their own dataset in this file based on their own Twitter API pulls, and may also plug in data from another reliable third-party social media analysis platform, such as SMAT, allowing for easy cross-referencing and analysis.

And that’s it! Hoaxy is a very simple and effective tool, allowing us to quickly obtain an overview of social diffusion and trend-sharing across various ecosystems on Twitter. The process, in short, can be summed up as follows:
- Choose a hashtag or phrase which you intend to analyze, i.e. one from the Twitter trends list. Put it in the recent live search box, and choose the language. Searching for a hashtag, rather than a keyword or phrase, allows us to more accurately determine geographic spread, while searching for a keyword or phrase tends to display total spread across Twitter.
- Click the play button to see the first account which mentioned the trend, and its subsequent spread across Twitter.
- Use the line graphs on the left hand side to narrow down a trend’s propagation on Twitter across an appropriate timeframe, which allows us to determine specific periods in which automated activity has occurred.
- Click on each individual circle belonging to each account to determine the process of spread, whether via mention, retweet, or quote-tweet.
- Use arrows plotted in the chart on the right hand side to determine the size and relative impact a group of accounts have on a particular trend, including whether accounts are tweeting to or from a major account, or solely amongst each other.
- Employ Botometer ratings, in conjunction with specific tweet activity information, to determine the likelihood of automated activity both from a specific account and from a group of accounts.
Above all, remember that verification of credibility regarding trends, hashtags, and Twitter accounts takes time, effort, and sustained contextualization to produce accurate results. Visualizing the spread of misinformation and disinformation is a critically important task, which means it’s also important to ensure accurate analysis. Hoaxy is one of many potentially useful tools in a disinformation analysis dataset – so don’t rush to conclusions, don’t hesitate to drop false conclusions, and remain patient until your work comes together.